Statistics on environment and products: Electronics, batteries, and vehicles
These are Denmark’s national statistics of quantities of electronics, batteries, and vehicles placed on the Danish market every year. The quantity of new products is compared with the quantity of similar products that have been collected or taken back as waste in the same period to get a life as reused products or secondary raw materials in new production.
Electronics
Electronics are the world's fastest growing waste stream. See how much we use and what happens when the products become waste. You can also see the environmental targets we must meet.
Batteries
Batteries are used for many daily activities, and they are produced in large quantities. Batteries contain substances that may harm the environment but that can also be recycled into new batteries - that is if we do not throw them in the bin.
Vehicles
Cars abandoned in nature make no sense, so we must make sure that old cars are taken to the car breaker's, so the car can be turned into new raw materials. Therefore, you receive money when you deliver your old car to the right place. See here how many cars we buy and scrap.
We are currently experiencing irregularities in how our statistics are displayed. We are working to resolve the issue as quickly as possible. As a result, some features and page views may be unavailable.
Basic data model
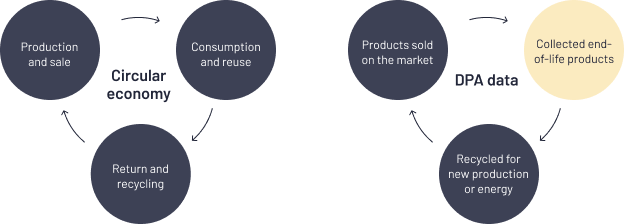
All registered and, thereby, approved producers and importers report every year to DPA how much they have sold on the Danish market along with the quantity of end-of-life products taken back and recycled into new products. The circular resource flow and the link to those data that businesses report to DPA can be illustrated as follows:
What information can I find here?
DPA produces regular statistics on electronics, batteries, and vehicles.
Statistics are produced on the following issues:
Priority material streams of:
- Batteries
- Vehicles
- Electrical and electronic equipment, and
- Generation, handling, and treatment of waste deriving from these products.
Every year in the period 1 January – 31 March all producers and importers covered by the European legislation on producer responsibility must report quantities of electrical and electronic equipment, batteries, and/or vehicles placed on the market, collected, and environmentally treated. Reports are submitted to the national producer register administered by DPA.
DPA also produces statistics of scrapped cars; we collect data from the Digital disbursement system (DUS) on the number of scrapped cars broken down as follows:
- Brand
- Model
- Region
- Age
The statistics collect data from the system on a continuous basis.
In the top menu you will find the most recent statistical data per product area. Under each product area there are links to sub-menus in the statistics leading you to the product area in question. Definitions and explanatory notes along with download of key figures appear from the icons under each table or figure. Below is an outline of concepts and reporting units used in the statistics.
| Product area | Abbreviation | Unit |
| Electrical and Electronic Equipment | EEE | Kilogram per category |
| Waste Electrical and Electronic Equipment | WEEE | Kilogram per fraction |
| Batteries and accumulators | BAT | Kilogram per battery type and substance group |
| End-of-Life Vehicles | ELV | Numbers |
The statistics are made available for you who are involved in the environment and resource area on producer responsibility, including the Danish market for collection and utilisation of resources contained in end-of-life electrical equipment, batteries, and vehicles. Primary players are mainly producers and importers of these products, car breakers, recycling facilities and waste carriers, local authorities, and compliance schemes. Other stakeholders are students, research and development institutions, the media, and similar players in other EU Member States.
Download
You can download data with the icon “Key figures” just like diagrams can be downloaded in different formats. Click the icon with the three bars in the right-hand corner off each diagram.
“Any reproduction and use of data must acknowledge the source: Danish Producer Responsibility, DPA, and date”
What are statistics used for?
Statistics on production of products and treatment of waste from businesses and private households are collected each year to measure general trends in production and waste generation, and to supervise the implementation of the EU waste policy as reflected by the waste hierarchy: prevention is the best option followed by reuse, recycling, and other forms of recovery, with disposal such as landfilling as the least preferred option.
Data on specific material flows are collected to supervise EU Member States’ compliance with quantitative targets, such as recycling and recovery rates as laid down in the EU waste legislation.
Waste related indicators make up a significant part of the monitoring framework of the circular economy, and they are important tools for the measurement of progress towards the targets for sustainable development.

